Technical trading is perhaps the most involved style of trading strategy, and one that is certainly not for the faint of heart. To a greater or lesser extent, most traders incorporate some elements of technical trading into their strategy. But for those who would choose the path of a technical trader, complex data analysis and statistical processing is in place to provide an overwhelming mash of at times contradictory indicators. Be that as it may, technical trading operates on the principle that the evidence never lies, and in drawing conclusions backed by figures and analysis of the data and price charts, many traders find their natural rhythm and trading consistency.
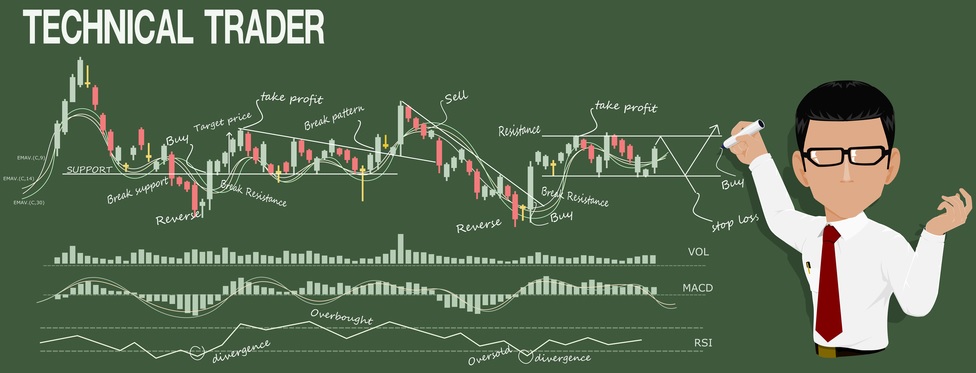
Technical trading is all about analysing graphs and price charts to identify certain patterns and spot anomalies which could give rise to a profit. The modern day trading arena – whether its CFDs, share dealing or whatever – is a sphere dominated by analysis, data and tools to help brokers make more informed decisions, and this is only on the increase as brokers continue to jostle for some form of differentiation from the crowd.
The theory goes that by getting to grips with past performance and price patterns, it becomes more possible to get a feel for the market’s tolerance to certain price points, making it that much clearer when a share becomes over- or under-priced, thereby leaving opportunities for significant profit.
Technical Trading Strategy Benefits
The key advantage to technical trading is that very little is left to hunch. When you’re sitting with price data over a period of the last few months, and you’ve established clear price limits and boundaries, it can after time become obvious when a share is on the move, and the indicators should ideally clearly point to a particular investment decision. The more analysis you conduct, the more comfortable you are with a share or market background, enabling you to be in a better position to better determine how to react to certain movements.
Of course, this has to be tempered by the complexity and the level of involvements technical trading requires. The process of analysing graphs and interpreting data is one best suited to those with a passion for numbers and arithmetic, and while most traders will to some extent enjoy mathematics and statistics, there can come a point with technical trading where it becomes a bit too much.
If you intend on building in technical analysis into your trading strategy to any great extent, it’s probably more advisable at first to do so on a staggered basis, taking cues from external factors like corporate announcements in addition to a cold, hard interpretation of the numbers – ideally to help break you in to your new trading strategy, if not from the point of saving your sanity.
Technical trading has a number of merits to it, and there is much to be said for the trader who is dedicated to sifting through charts and graphs throughout the trading day. It’s not an easy path to tread, but building a level of competent comprehension when it comes to trading statistics can help identify a wealth of subtle trading opportunities that other strategies may fail to pick up on.